Water and energy conservation in distribution of water using the Internet of Things
This article is part of the Smart Water Solution series.
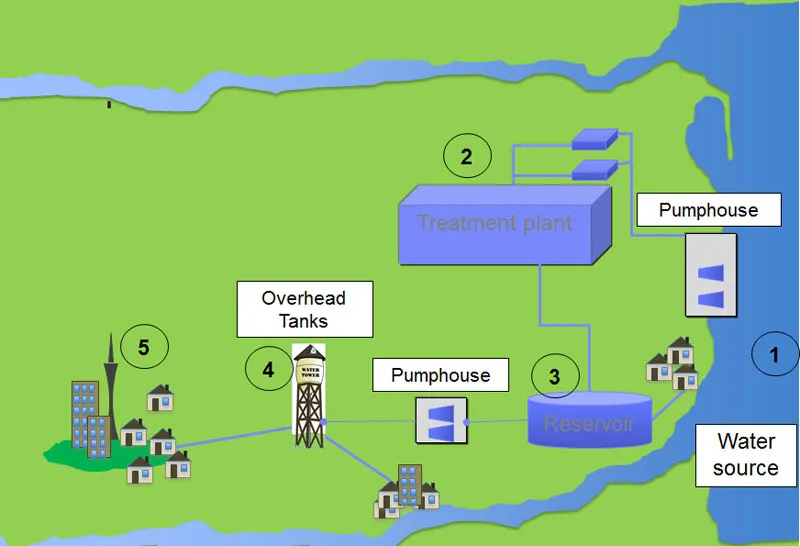
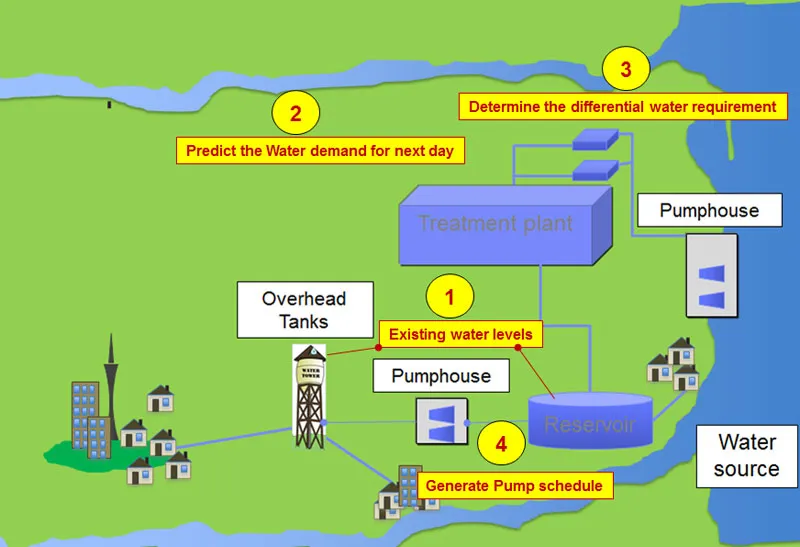
Before explaining the solution let me give a view of how water flows into the taps in your houses. Cities usually source water from rivers, lakes, and ground water reservoirs. From these water sources, the water is pumped (from pump houses) into treatment plants through pipes. Water is cleaned at the treatment plant and from there it is piped into reservoirs. The reservoir is the storehouse for the treated water.
Water is pumped from these reservoirs to the overhead tanks spread across the city. The water then gets distributed to houses and factories through a network of pipes working on gravitational force. In some cases, the water is directly supplied from the reservoirs to the houses.
The numbered steps in the following diagram illustrate the water flow:
The solution that we are going to discuss is about water and energy conservation in the distribution of water.
This solution will ensure that the right amount of water is present in the reservoirs or overhead tanks at minimum cost of operation to the pump houses. To achieve this a combination of Internet of Things (IoT), predictive analytics, and optimisation techniques are used.
To begin with, level sensors are deployed in reservoir and overhead tanks. Level sensors are devices that ascertain the level of water or any liquid in a container, and communicate this reading to a central server. (To get a better understanding of Internet of Things you can go through this article “Create your first Internet of Things application in under 30 minutes with IBM Bluemix.”)
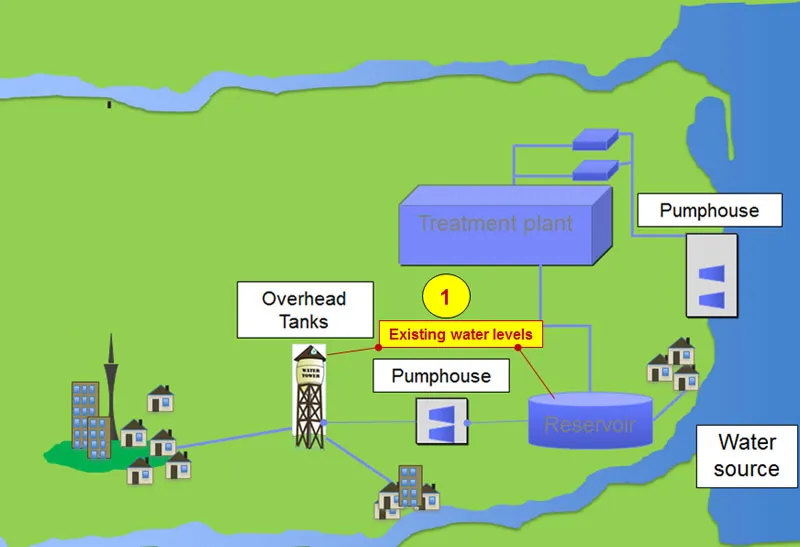
These level sensors will be sending information about the water levels at the reservoirs and the overhead tanks on a periodic basis. By knowing the level of water, it is possible to calculate the volume of water present in the tanks and reservoirs.
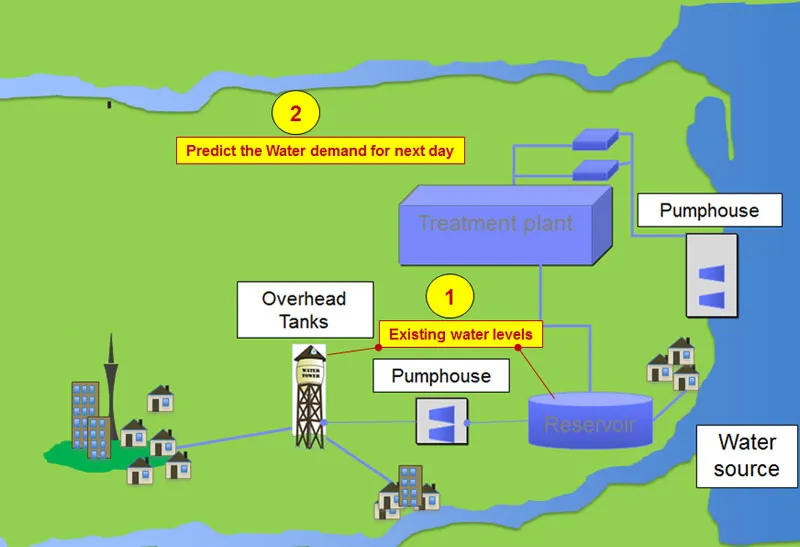
The next part would be to determine the demand of water a city would require for the next day. City authorities can calculate this by using predictive analytics. Predictive analytics can forecast the water requirement for a city based on historical consumption, as well as, taking into consideration the weather, holidays, events, etc. For example, water consumption in the month of winter could be less, and in the case of a festival like Holi (played with water and colors), it would be higher. Taking into cognisance the water present in the overhead tanks and the reservoirs, vis a vis the water that is required for the next day, the solution then generates a schedule for the water pumps to meet the city requirements.
The solution doesn’t stop here. What if the energy prices change through the day? In this scenario, city authorities can save energy costs by running the pumps when the cost of electricity is least, and at the same time ensure that water levels are maintained. If the price of energy is static, then the city authorities know that for a particular hour for a day, the price would be fixed.
Lastly, the solution also factors in maintenance schedules or shutdown of the pumps through optimization techniques.
The goal of the optimisation technique is to ensure that the water is supplied by the pumps to the overhead tanks and the reservoirs to meet the city`s water demand, while keeping the energy costs lowest by factoring the capacity of pumps at various times (since a shutdown of the pump will change the capacity of the pump house).
In some cities (though not in India) energy pricing is dynamic: it keeps changing depending on the demand of electricity by the consumers and the supply available -- the price at which the city is procuring energy. In which case, the solution with the help of predictive analytics, determines the prices of energy for the following day at different hours. And then runs the optimization algorithm to generate the schedule of the pumps, obviously keeping the prices of energy lowest and ensuring that the water supplies are met.
I will recap the solution in the following steps:
Step 1.) Through the level sensors in overhead tanks and reservoirs the water available for supply is ascertained.
Step 2) The water requirement for the next day is forecasted using predictive analytics.
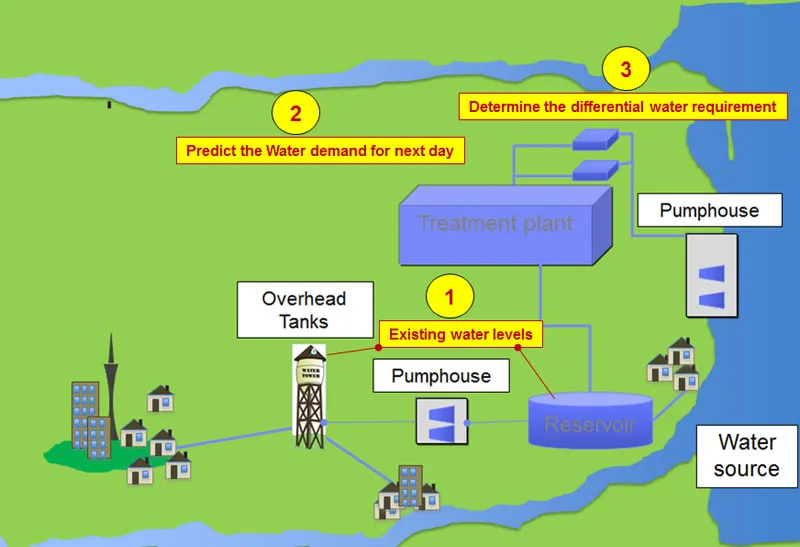
Step 3) Water required for the city is arrived at by subtracting existing water levels from the water demand predicted.
Step 4) A pump schedule is generated to meet the water requirement, while minimising the energy consumption of the pumps, as well as, taking into consideration the scheduled maintenance of the pumps and their shutdowns.
Lastly, I will now illustrate the working of this solution with the solution blocks of the Smart City Solutions described in the earlier articles: What it takes to be a Smart City – Part 1; and What it takes to be a Smart City – Part 2
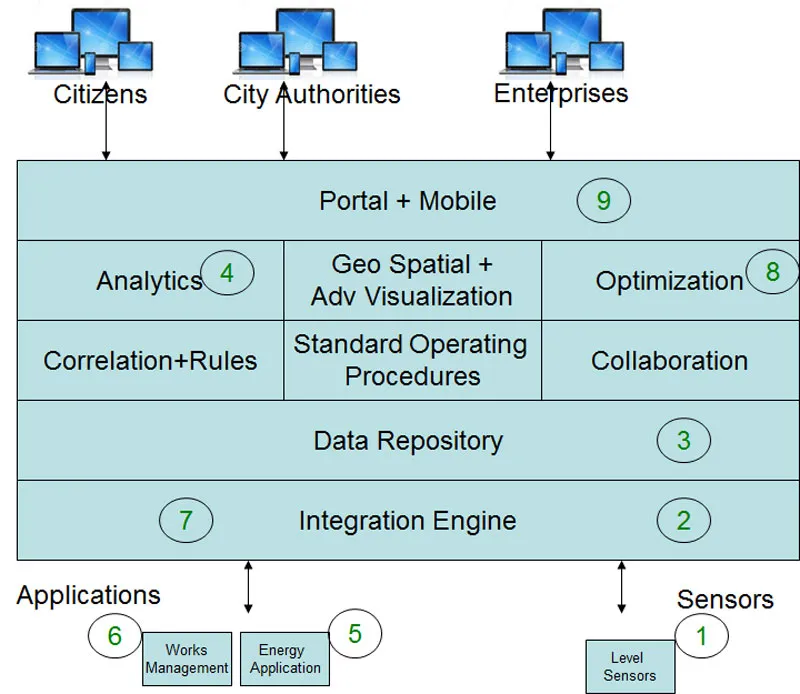
- Level sensors send the information regarding the level of the water in the tanks and reservoirs at regular intervals.
- The information is received by the integration engine.
- The information is stored in the data repository.
- Predictive analytics is run to forecast the demand of water for the next day, and the requirement of the water that needs to be pumped is ascertained taking into consideration the existing water present in the tanks and the reservoirs.
- Energy prices for the following day are fetched from the energy application.
- Information on pump maintenance scheduling and breakdowns is fetched from the maintenance management applications for water works.
- The information generated in steps 5 and 6 is captured by the integration engine.
- The optimisation algorithm is run to determine pump scheduling.
- The information is shown in the portal for the city authorities to act upon.
Watch this space for next article again on smart water.


